Let’s be honest, for many of us the data view tables can be a terrifying beast. You may know of their benefits but believe it too complex for you to understand. Well, hopefully after reading this blog, you will not only have a better understanding of them, but be able to figure out how to get the most out of the Data View Tables.
Let’s first start by explaining what they are. The Data View Tables are a collection of tables that store all our behaviour data. Behaviour data is data that is collected every time a subscriber engages with any message we send through Marketing Cloud.
These Data View Tables are not tables that you necessarily just see. What I mean by this is you need to run an SQL query to see the Data - and this is where people sometimes find themselves confused and unsure.
The first thing you simply need to realise is that they are just tables of data, very much like a table of data that you store your Subscribers in. Take a look at this Salesforce article with a serious of sub-articles, showing each Data View Table and which fields are in them.
The next trick is figuring out how to relate it all together. For example, if I want to get a list of subscribers who have received an email for a certain journey but haven’t opened it, you need to create an SQL that is looking at 5 different Tables, they are:
- Subscribers (individual Subscriber)
- Sent (to confirm the Subscriber received an email)
- Journey (to confirm what journey this send was part of)
- Journey Activity (to work as a junction between Journey and Sent)
- Open (to confirm the Subscriber does not exist in this table)
And at the end you’re left with a SQL Query, that looks like this:
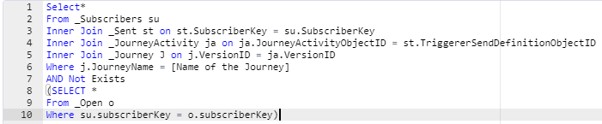
Simple...right?!?
It honestly can be, once you understand how the relationships work. Below is a diagram that allows us to understand how the Tables are related to each other.
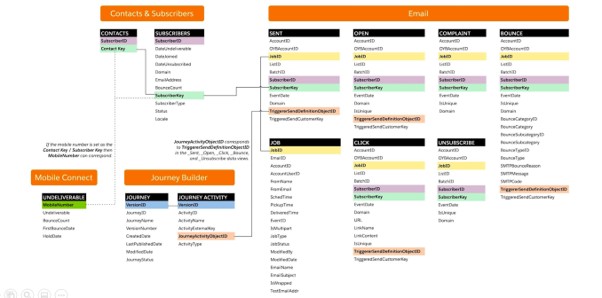
When you look at this, you can see why we had to use the Journey Activity table to work with Journey and Sent tables.
Let’s take another example, you want a list of Subscribers who clicked on a certain link from a certain email in the last week.
The first step is to determine what tables we need. So, from our criteria we need to know:
- What is the Name of the email? If you look at the Job Data View Table, you can see a field called “EmailID”. So, we need the Job Data View Table
- What is the Name of the link? If you look at the Click Data View Table, you can see a field called “LinkName”. So, we need the Click Data View Table
We will also need the Subscriber Data View Table as that will literally be the individuals who received the email, some of whom clicked on the link.
Now we need to relate those subscribers to the Jobs and Click. As you can see there no direct relationship for that to happen, so we need the Sent Data View Table to work as a Junction.
So, now we have everything together, it’s time to write the query.
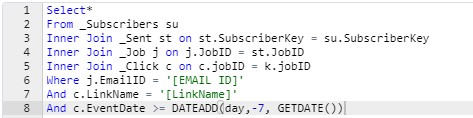
Remember the FROM section will ultimately be the master table of data.
Well there it is. All you can do now is practice and have fun with it. It’s also worth mentioning that our expert Sam is delivering a presentation at London’s Calling 2020 on this very topic on the 20th March so if anyone would like to talk to us in person, please come and introduce yourself.