Tableau CRM has so many incredible features that is only natural for some of these features be lost in the crowd. We are here to explore some of those awesome features by looking at the following...
- Setting Initial Selections in the Dashboard
- Filter the Dashboard Results with Faceting
- Optimize Dashboard Performance
Set Initial Selections in the Dashboard
Firstly, if you are looking to set your initial dashboard selection you need to have selection-based widgets such as chart, date, list, range, or toggle. This is where you can set initial selections that will be automatically applied when the dashboard first opens for your users. Tableau CRM will remember these selections as a start value for your end users to see when clicking on the dashboard. This is great for users in showing them the correct data the second they click onto the dashboard.
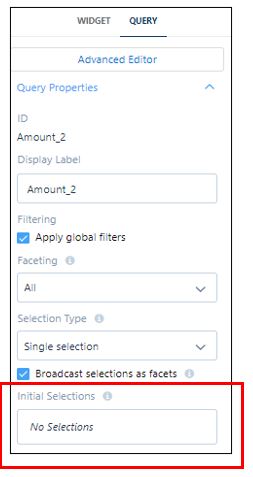
Whilst in edit mode on the dashboard, click the drop-down arrow and click Pick Initial Values. You can then choose your initial selections within Query Properties.
Finally click Done.
Tableau CRM will remember these selections as a start value for your end users to see when clicking on the dashboard.
If the Dashboard contains Global Filters you can also set these initial filters for when the dashboard is opened. This also has the benefit of being locked if we want the information to stay the same.
Filter the Dashboard Results with Faceting
One incredible feature just covered and the second is here. Faceting is a smooth and very useful way to set how your widgets can interact with each other. When the base query is faceted on a selection-based widget this can automatically have a knock-on effect on the queries associated with other widgets on the dashboard.
Let us say we select a Region in the US from a widget list, Tableau CRM then filters the dashboard’s table widget based on that region. We can use targeted faceting to exclude a total sales pipeline number widget, so the number isn’t changed when selecting an individual region.
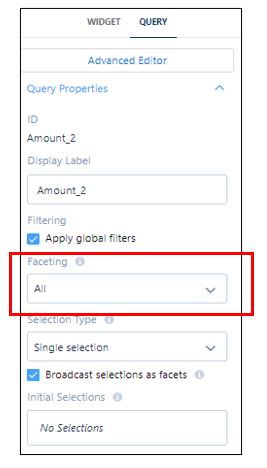
Click the pencil icon to edit the dashboard and then select the widget that is using the query and head to the properties section.
In the Faceting section of the query panel, you can then select All, Include, Exclude, or None depending on your preference.
Optimize Dashboard Performance
You’ve seen 2 fantastic features so let’s continue and show you the final feature of the blog. If you are ever wondering if your dashboard is running to its peak performance, you can Optimize Dashboard Performance by using the Dashboard Inspector. This allows us to identify any unused queries, queries with issues and even provides us guidance to help improve the dashboard performance.
Whilst in View Mode on your dashboard, click the drop-down arrow and select Dashboard Inspector.
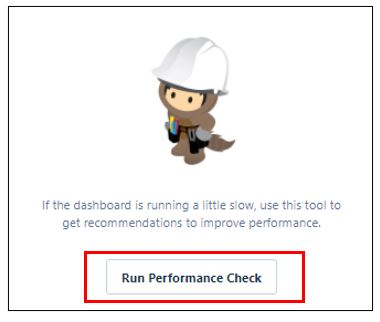
Click Run Performance Check and wait for the inspector to carry out its investigation. Once the results are returned you will see the queries which may need your attention including recommendations on how to optimise.
For any help and advice on Tableau CRM, contact us!